


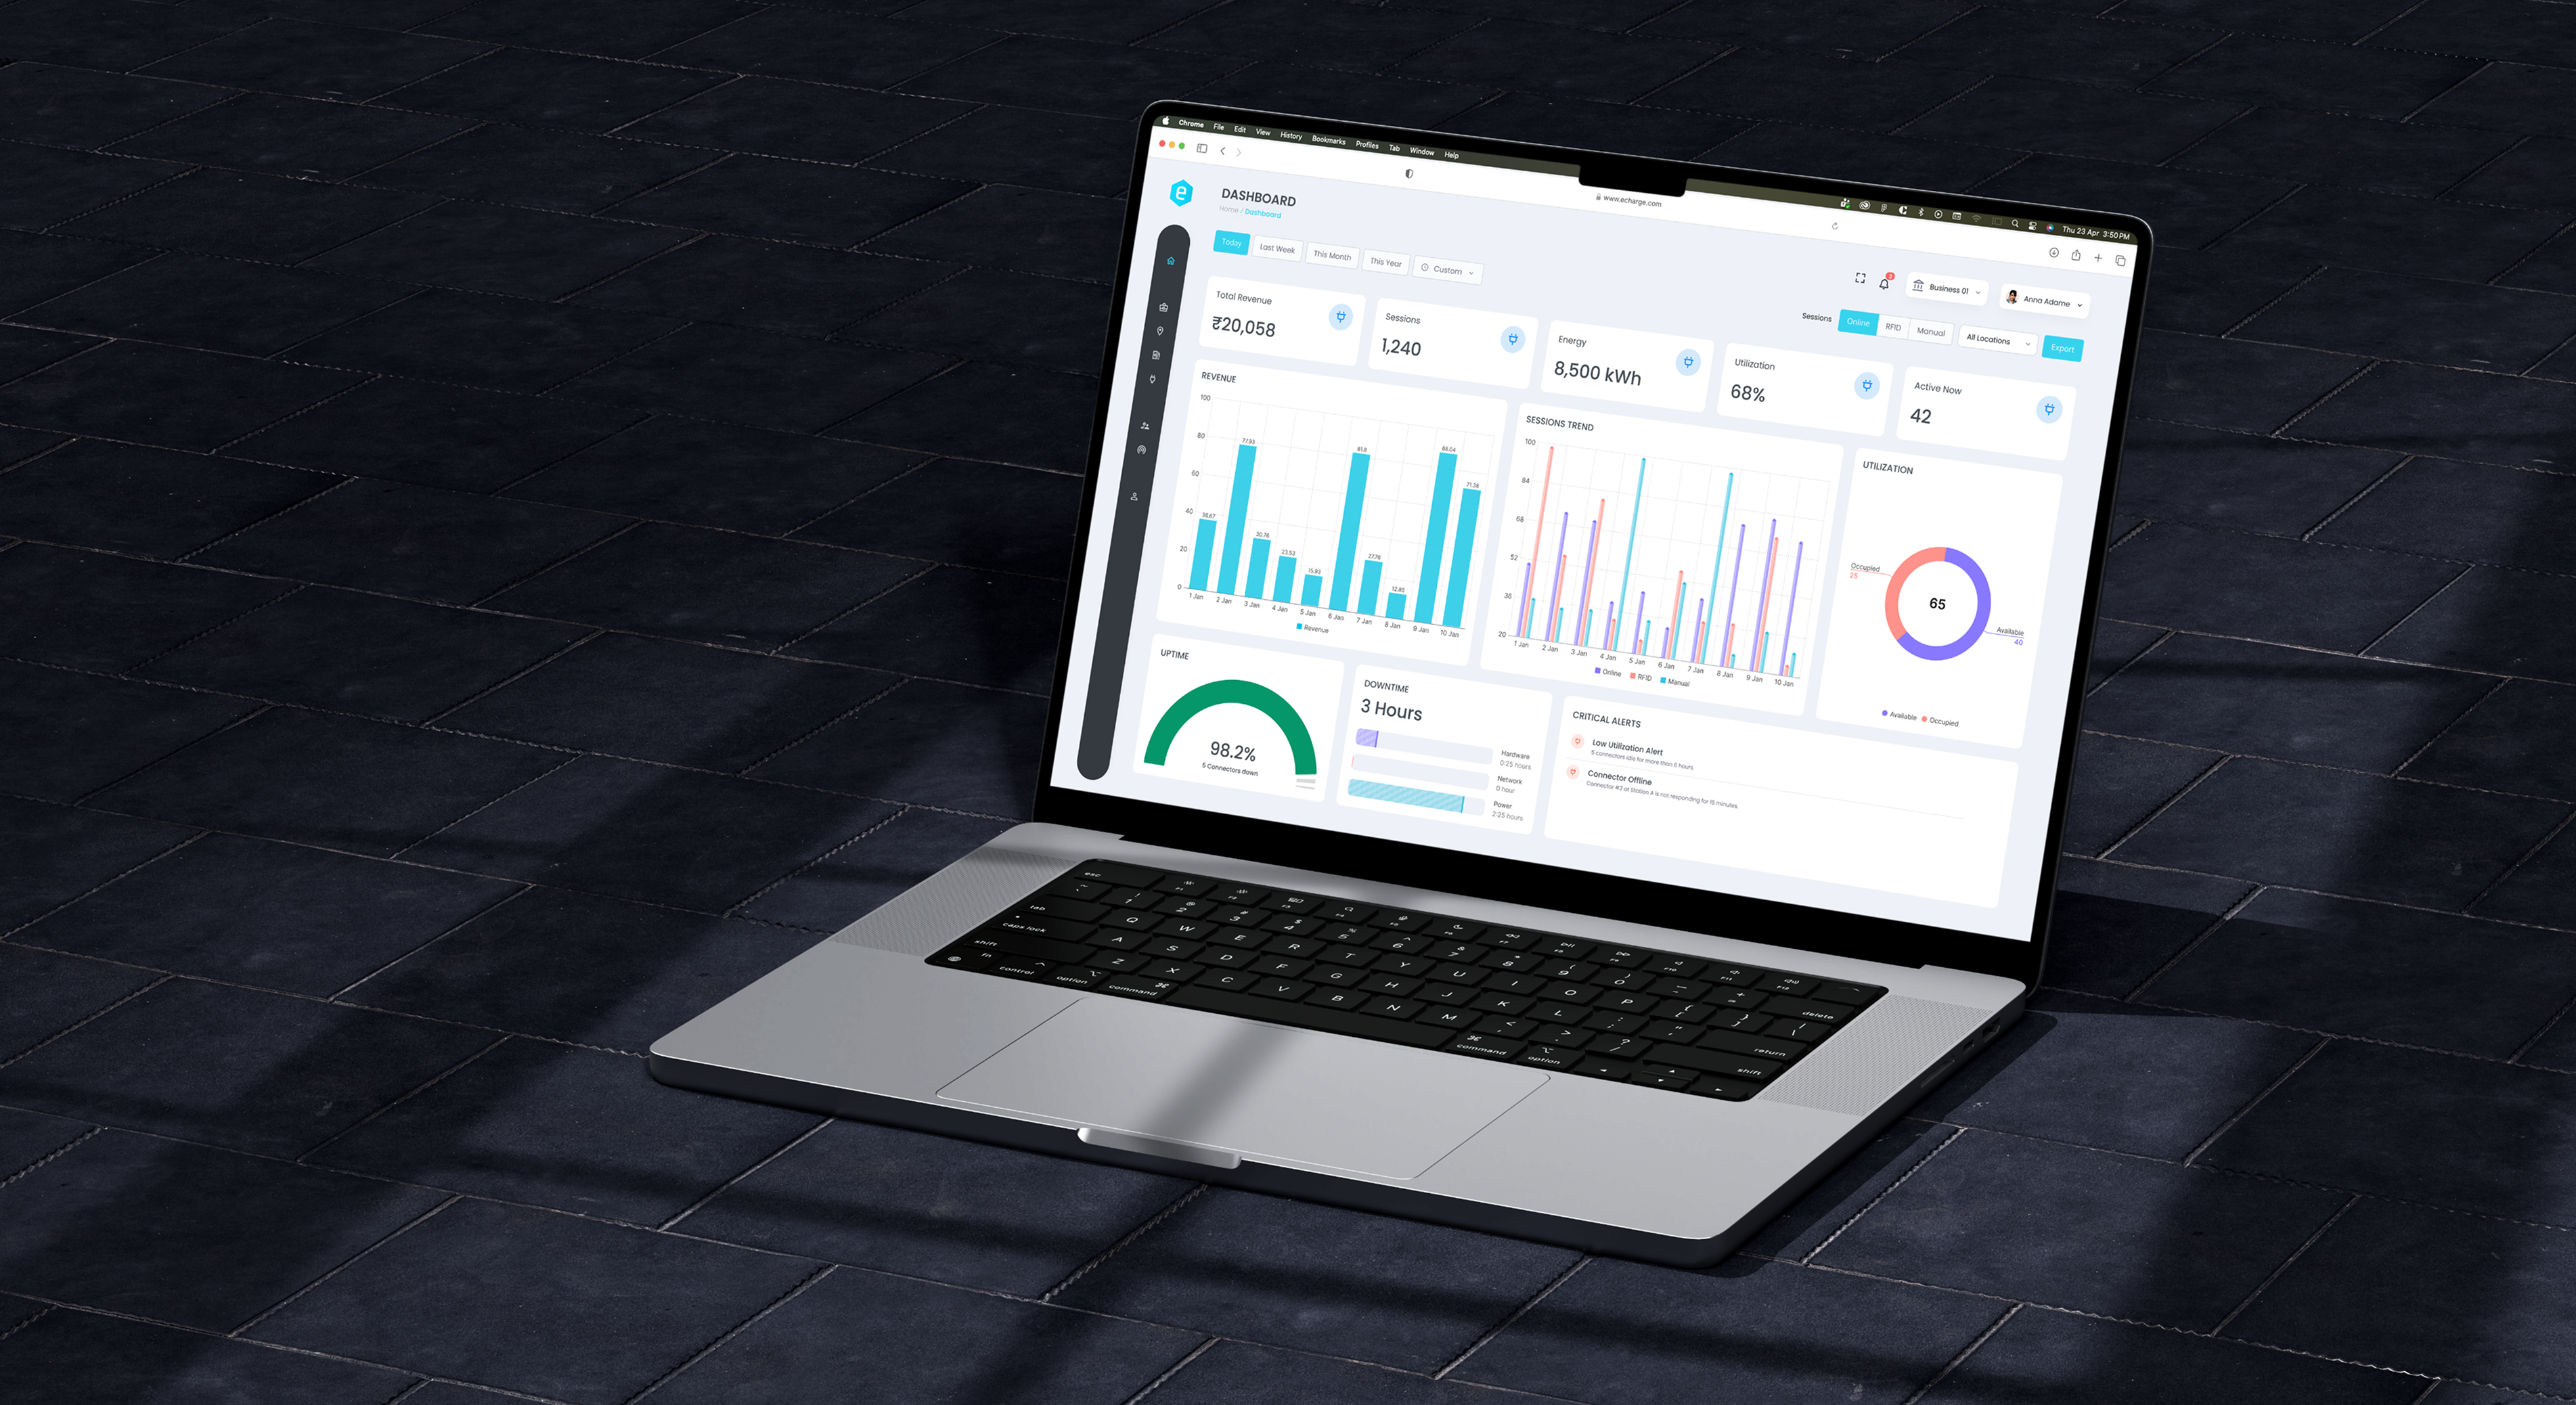
This project focused on transforming raw charging data into decision-driven dashboards, enabling business owners to monitor performance, optimize infrastructure, and improve revenue efficiency.
After launching the MVP, the platform scaled rapidly to:
Hundreds of charging sessions daily. While growth validated the product, it also exposed a critical gap:
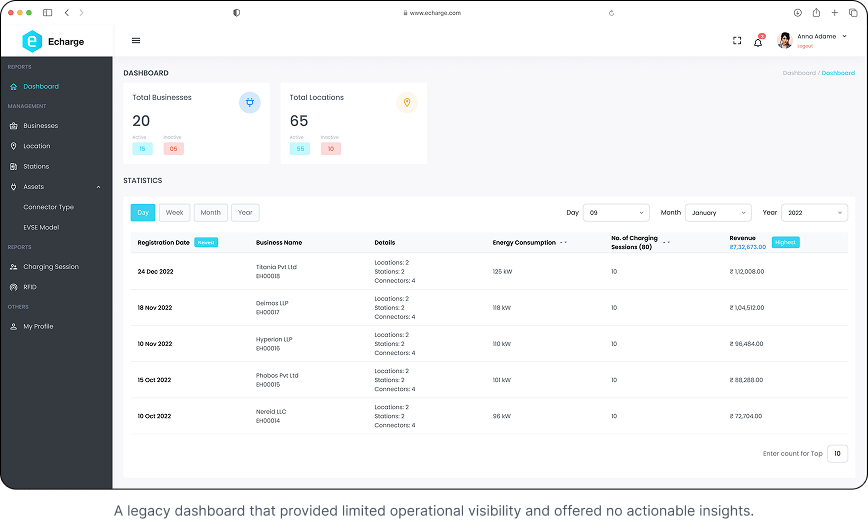
The Problem
The system worked operationally - but failed strategically.
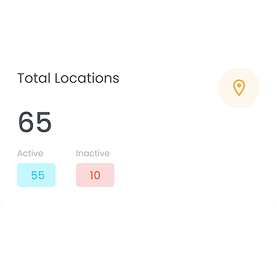
Business owners couldn’t track performance across locations.
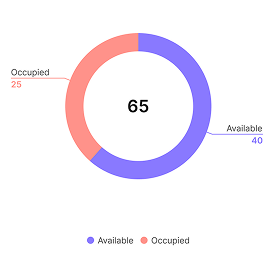
No clarity on station or connector utilization.
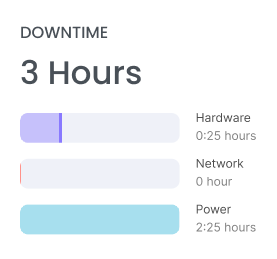
Difficult to identify downtime, failures, or inefficiencies.
As the network scaled:
- Business owners couldn’t track performance across locations
- No clarity on station or connector utilization
- Difficult to identify downtime, failures, or inefficiencies
- Manual tracking via spreadsheets increased
- Decision-making became reactive instead of proactive
Key Issues
- No centralized analytics dashboard
- Lack of real-time and historical insights
- No KPI tracking for business performance
- High dependency on support teams for data
- Inability to optimize revenue and utilization
Users and Research
Why it started?
Growth introduced complexity.
Operators managing multiple locations began asking:
- "Which station is performing best?"
- "Why is this connector underutilized?"
- "Where are we losing revenue?"
- "How do we track charger downtime?"
Who are we solving for?
We divided users into power users and non power users.
- 1. Business Owners / Admins - Need high-level KPIs and focus on revenue, growth, and expansion.
- 2. Operations Managers - Monitor stations, uptime, and efficiency and handle maintenance and issue resolution.
- 3. Ground Staff / Technicians - Need alerts and actionable insights and focus on fixing problems quickly.
How are we solving it?
We conducted:
- Data audit of charging sessions
- Stakeholder interviews (admins + ops teams)
- Dashboard benchmarking (EV + SaaS analytics tools)
- Heuristic evaluation of existing system
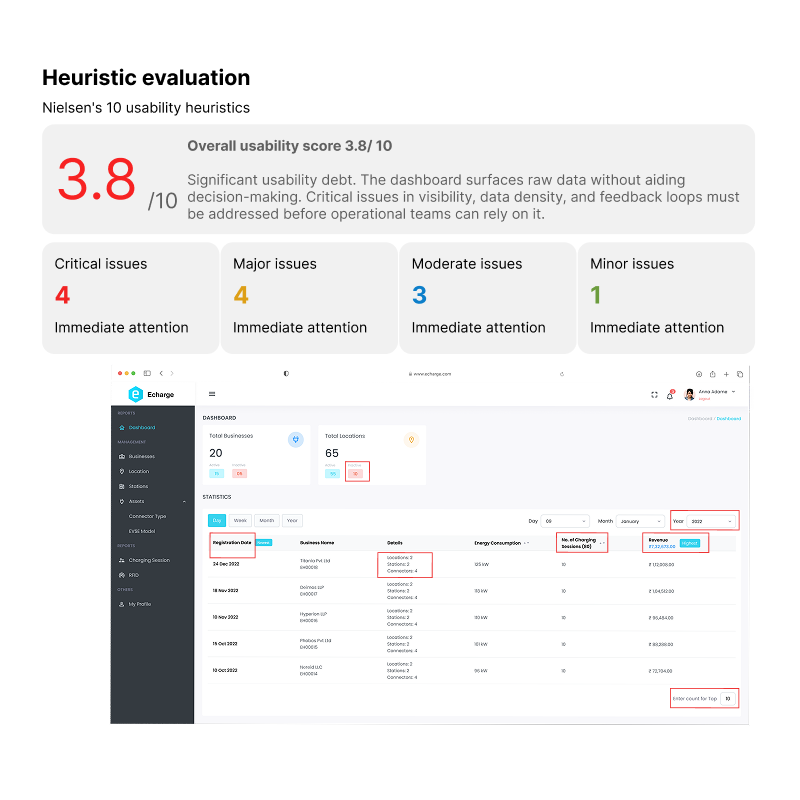
Heuristic evaluation
Revealed inconsistency, clutter, poor hierarchy, and low discoverability.
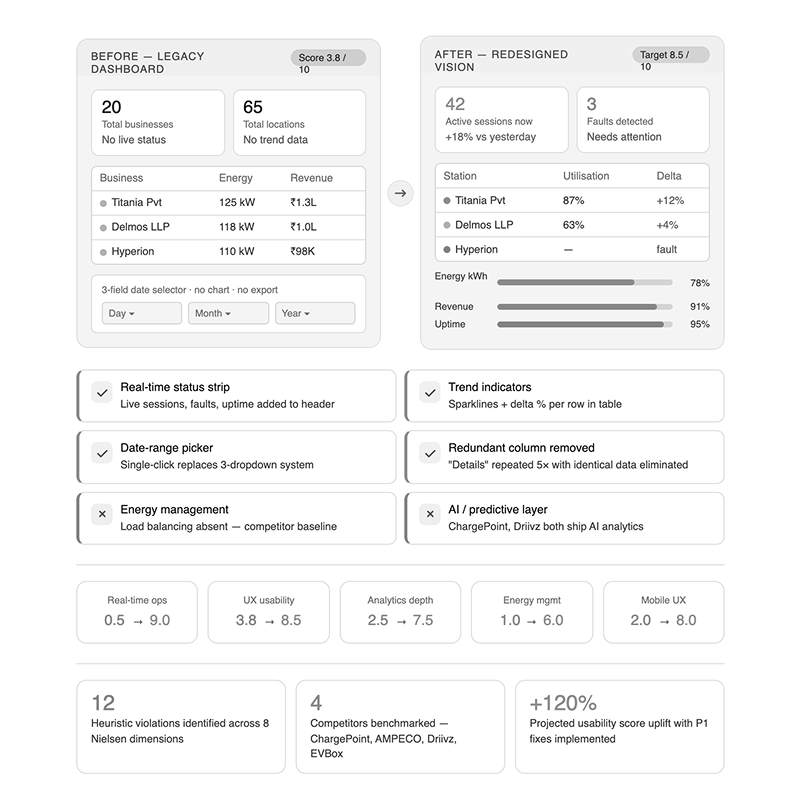
Competitive benchmarking
Revealed modern standards our dashboard lacked
Frustrations & Findings
Core Insight: The problem was not lack of data — it was lack of structured insights.
Frictions We Identified
Redesign
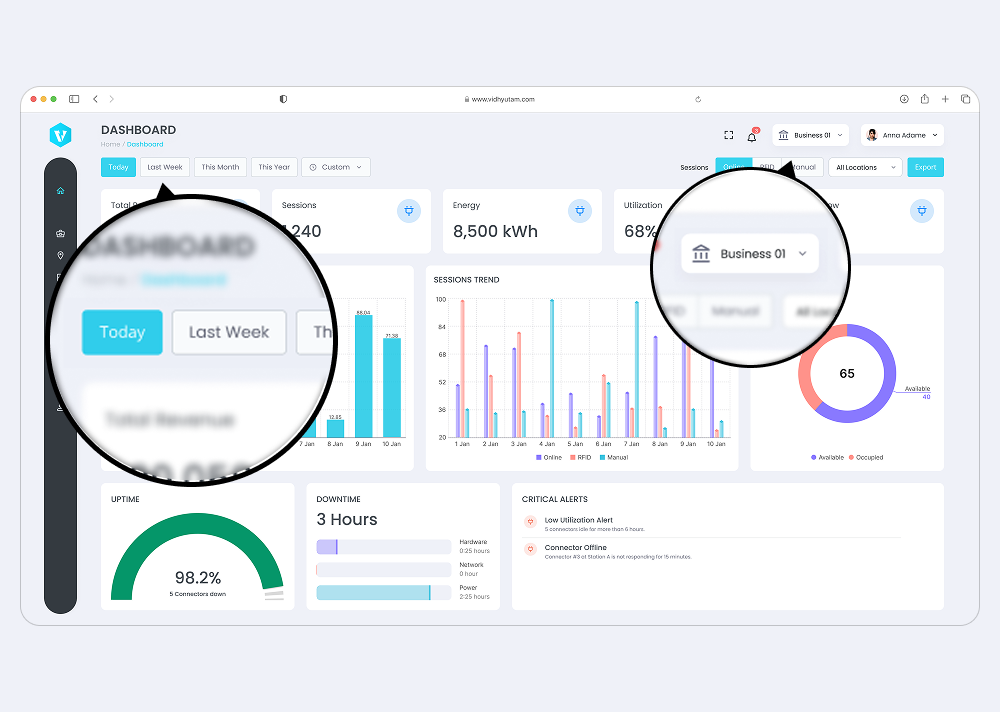
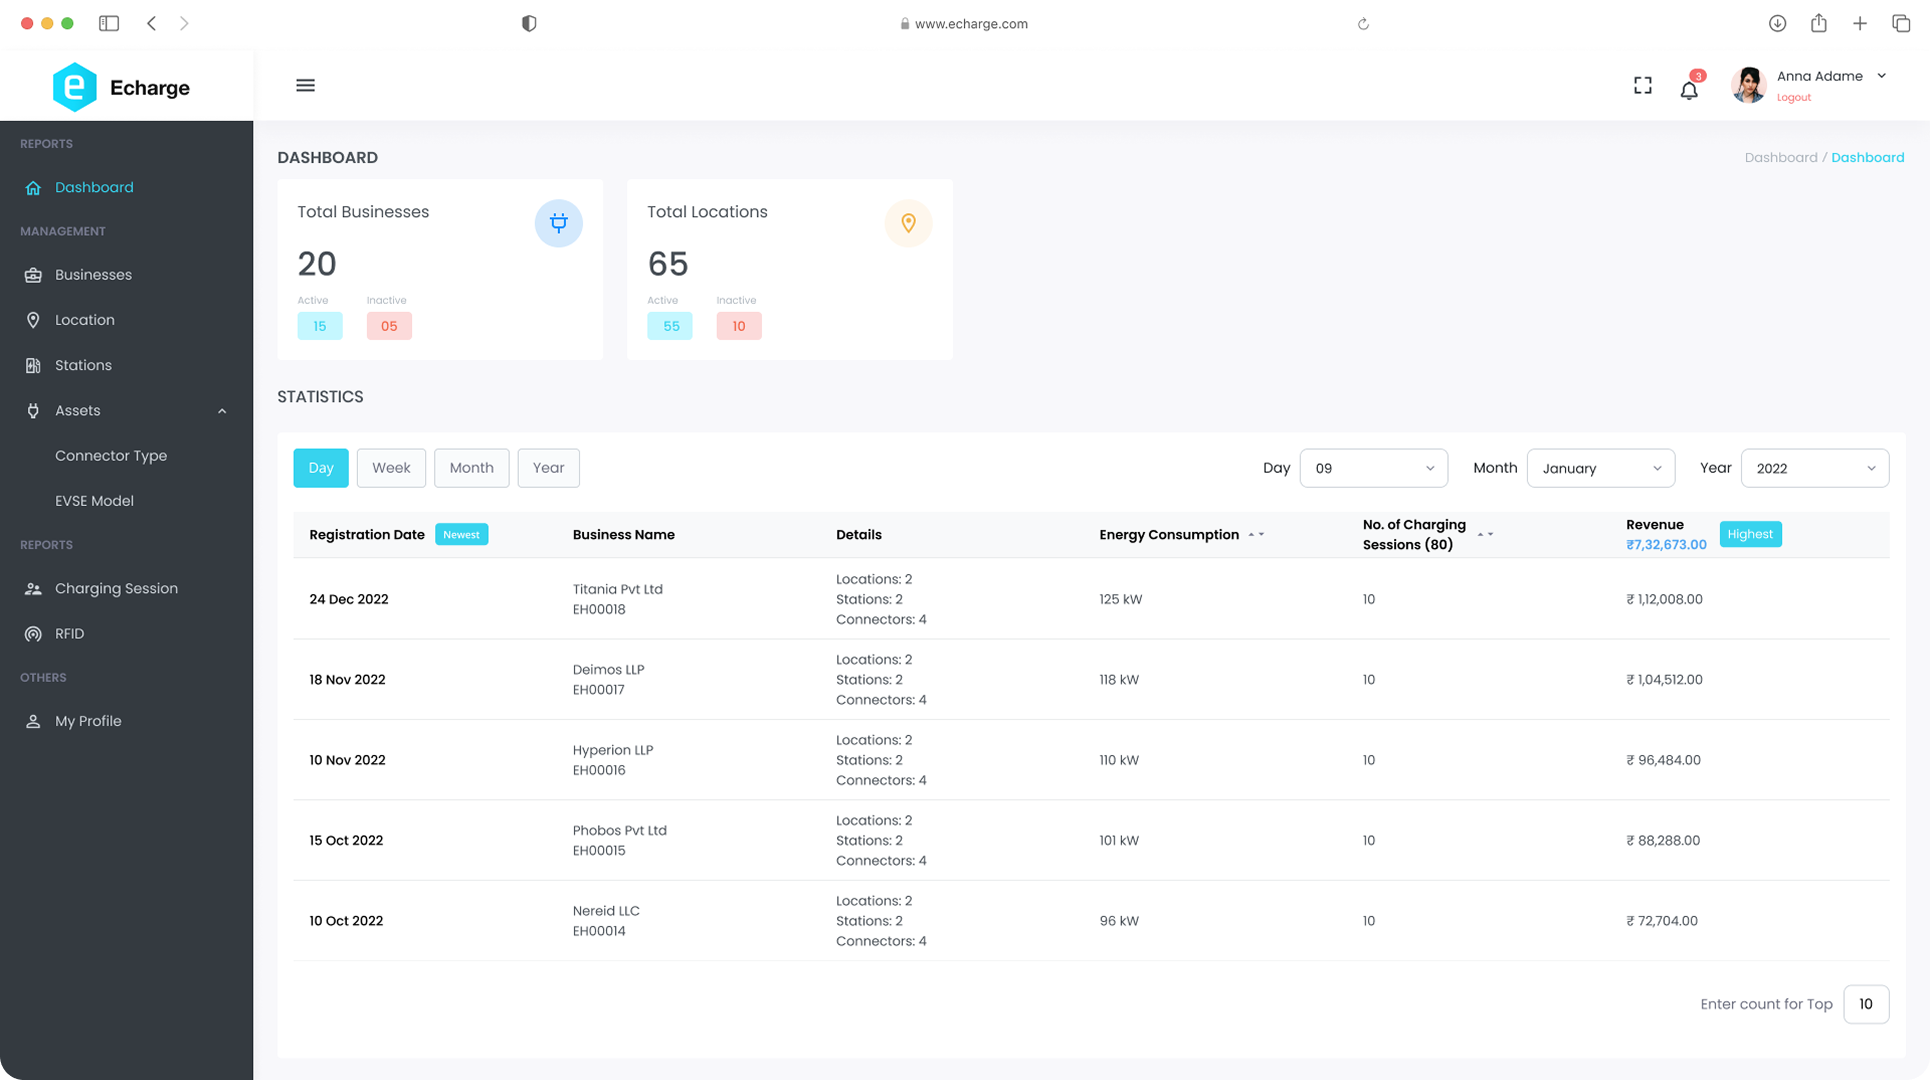
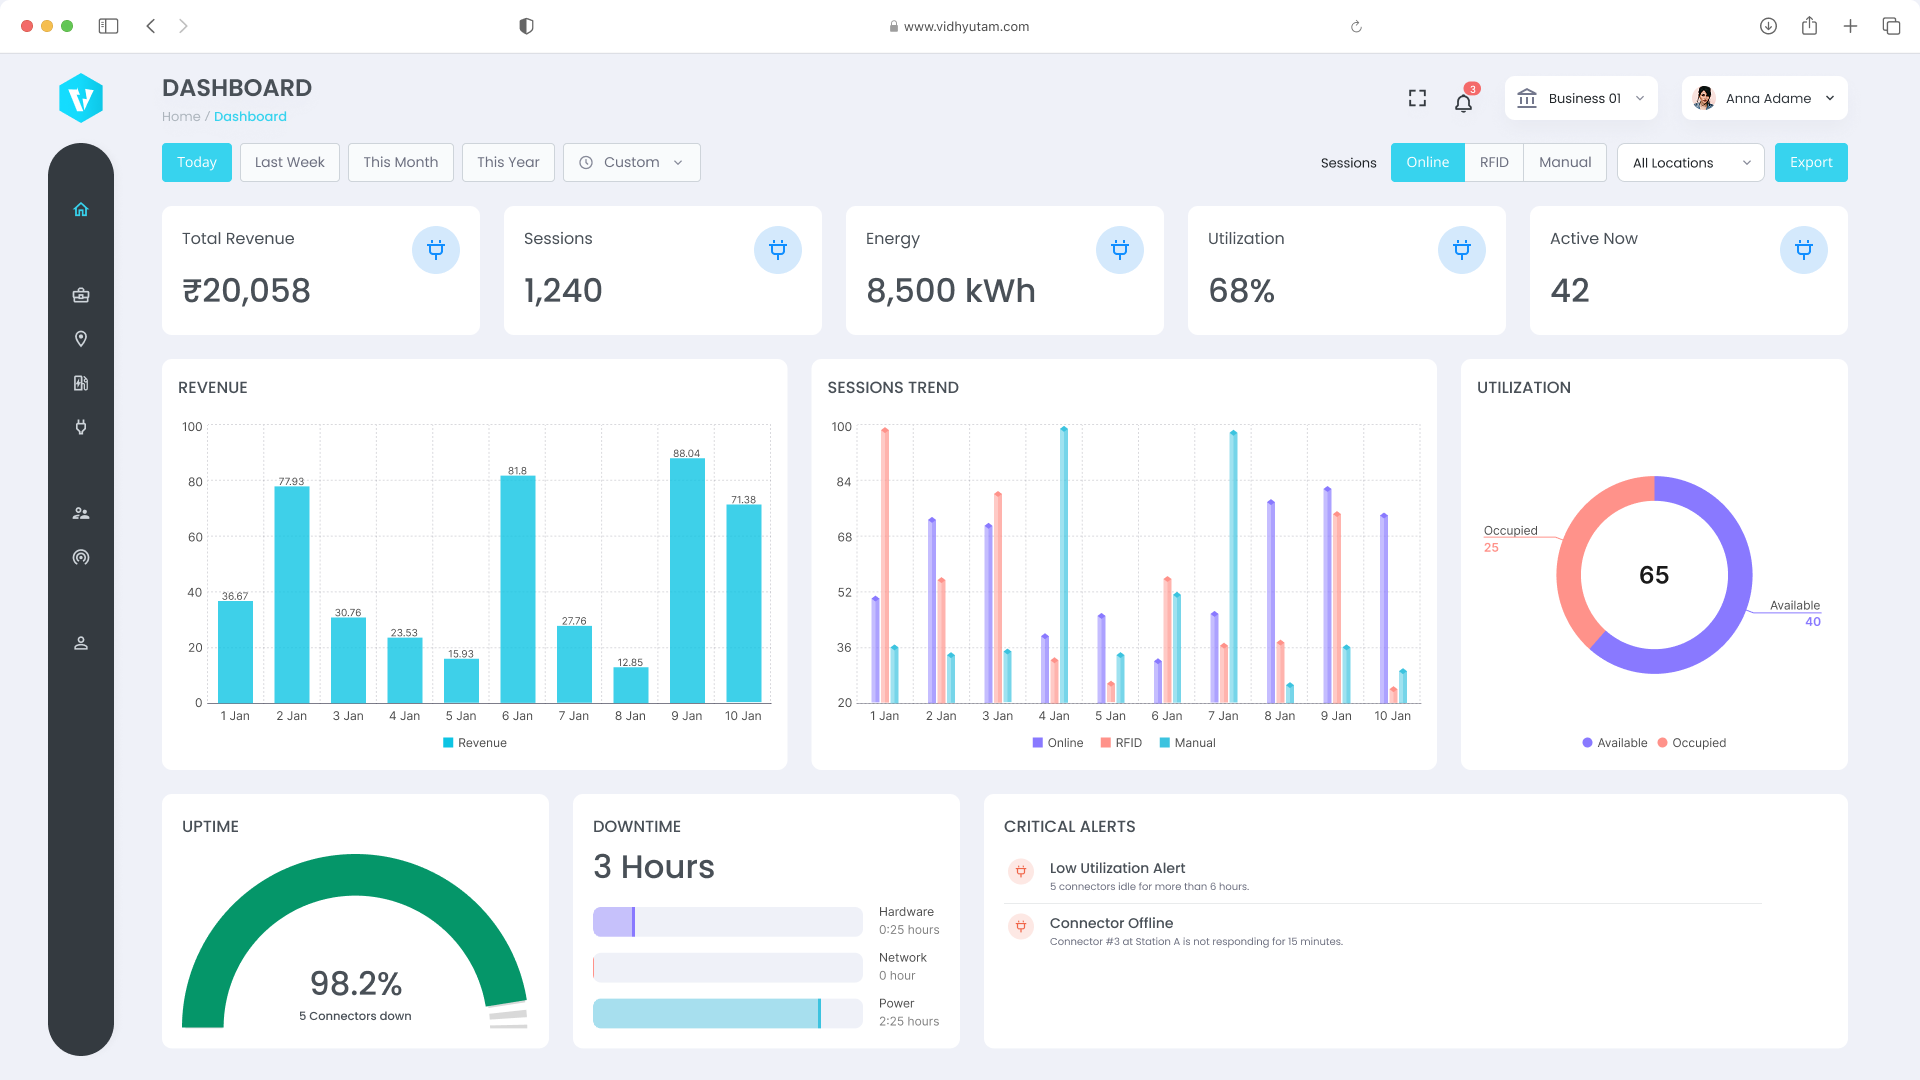
We redefined the system into a data-driven operational dashboard.
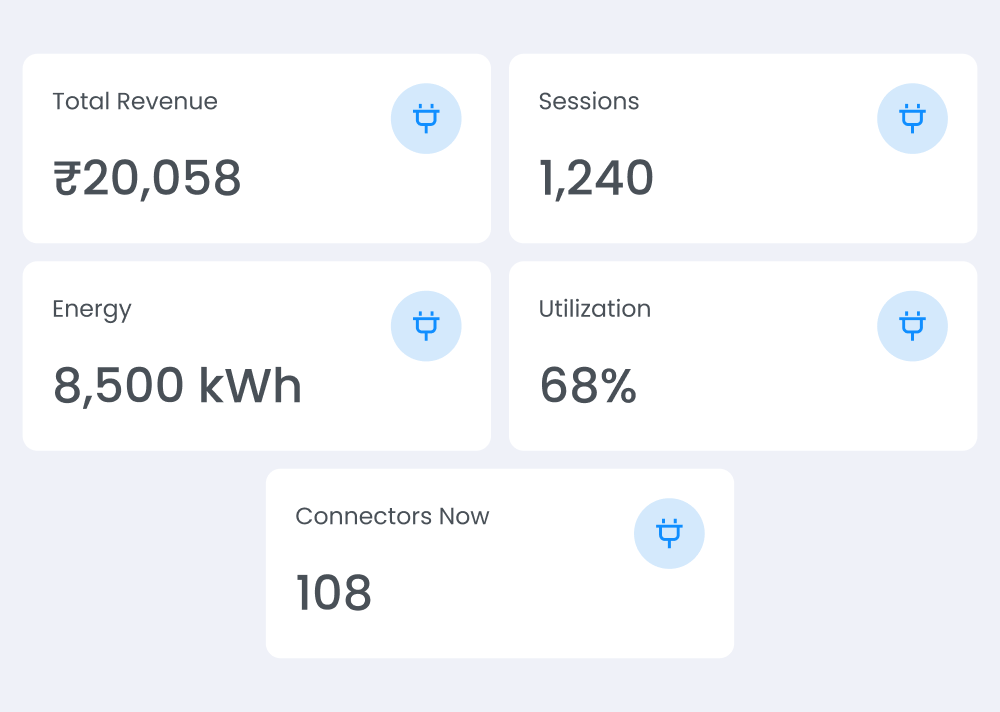
1. KPI-Driven Dashboard
Introduced top-level business metrics:
- Total Revenue
- Total Charging Sessions
- Energy Delivered (kWh)
- Active vs Idle Connectors
- Peak Usage Time
This gave instant clarity on business health.
2. Multi-Level Data Visibility
Structured hierarchy:
Global → Location → Station → Connector
Users can now:
- Compare locations
- Drill down into station performance
- Analyze individual connector efficiency
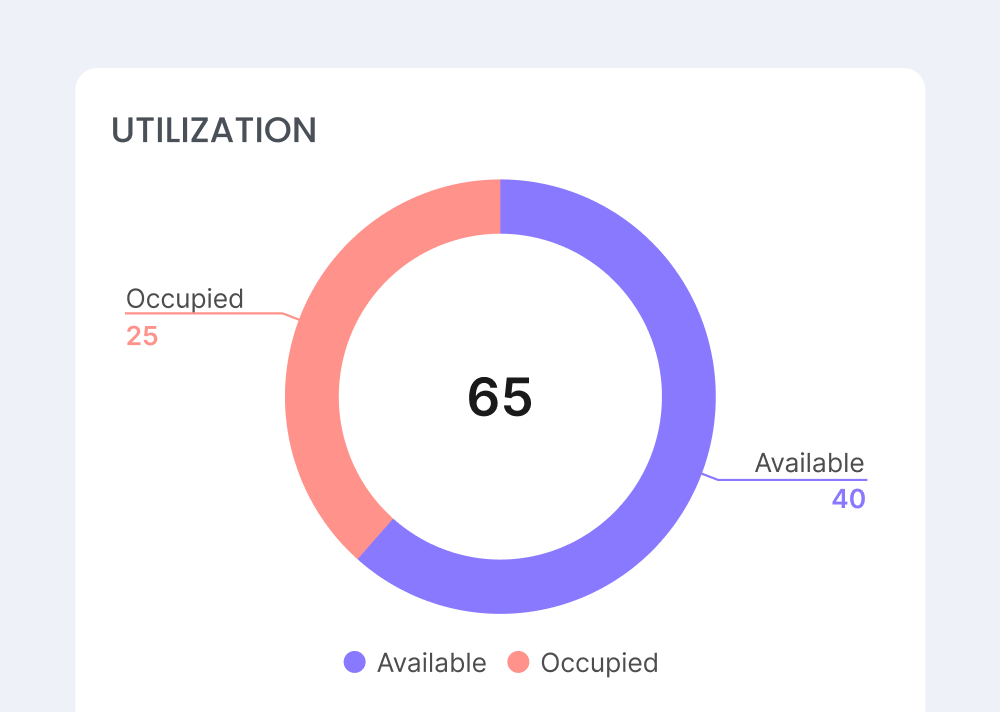
3. Utilization & Performance Insights
New metrics introduced:
- Connector Utilization Rate
- Average Session Duration
- Idle Time Analysis
- Peak vs Off-Peak Usage
This helped identify:
- Underperforming assets
- Overloaded stations
- Expansion opportunities
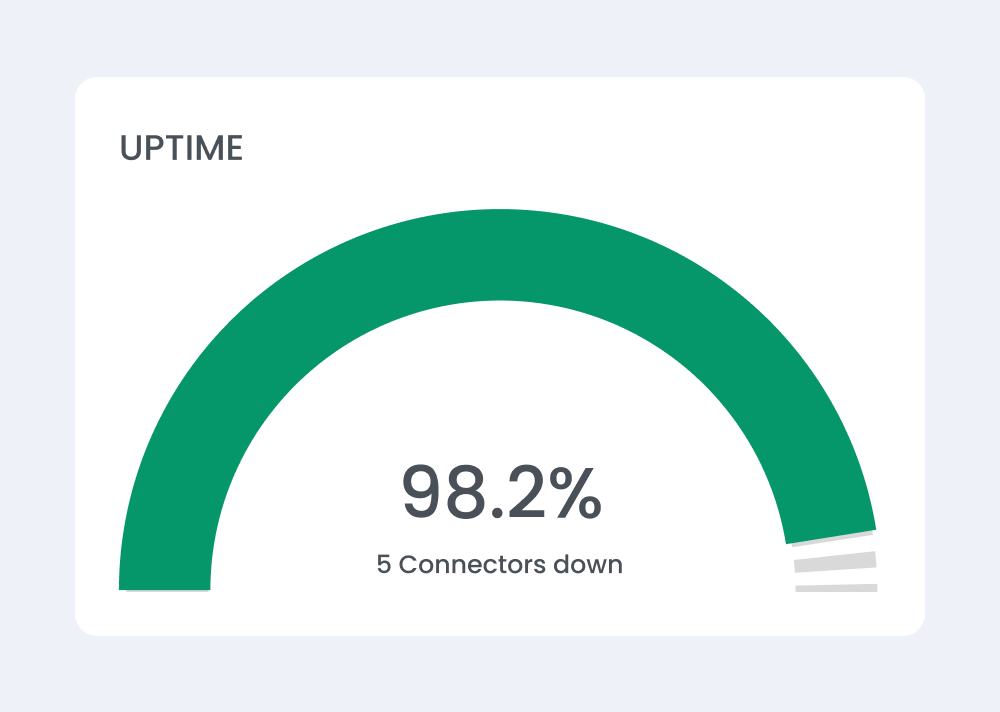
4. Real-Time Monitoring
- Live session tracking
- Active charging indicators
- Status: Available / Charging / Faulted
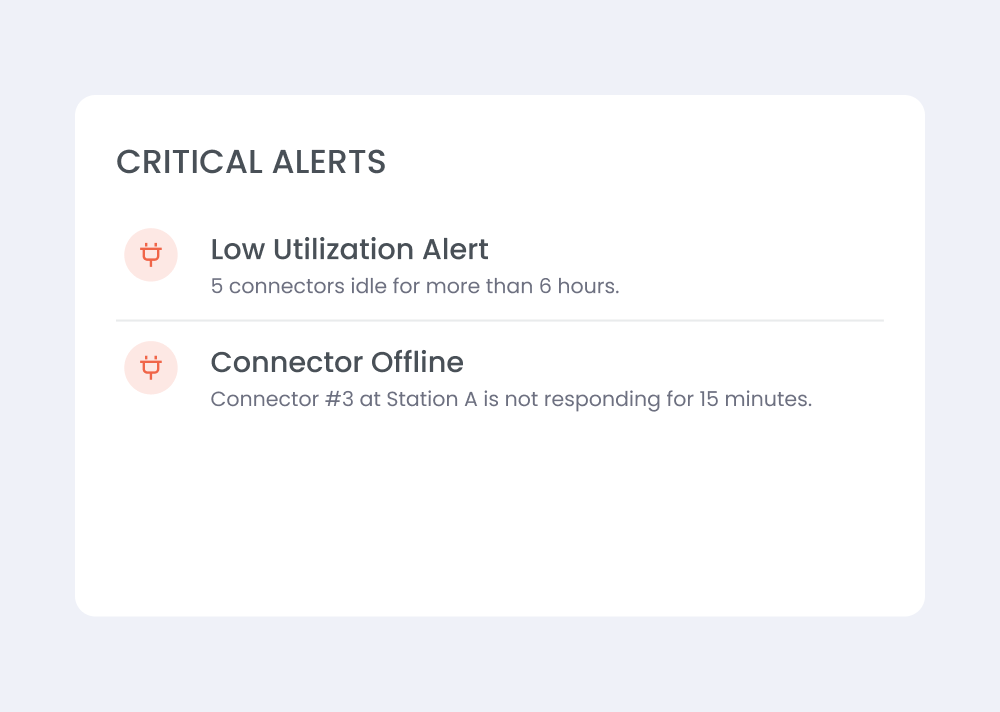
5. Smart Alerts & Issue Tracking
- Charger downtime alerts
- Session failure detection
- Maintenance triggers
Reduced dependency on manual monitoring.
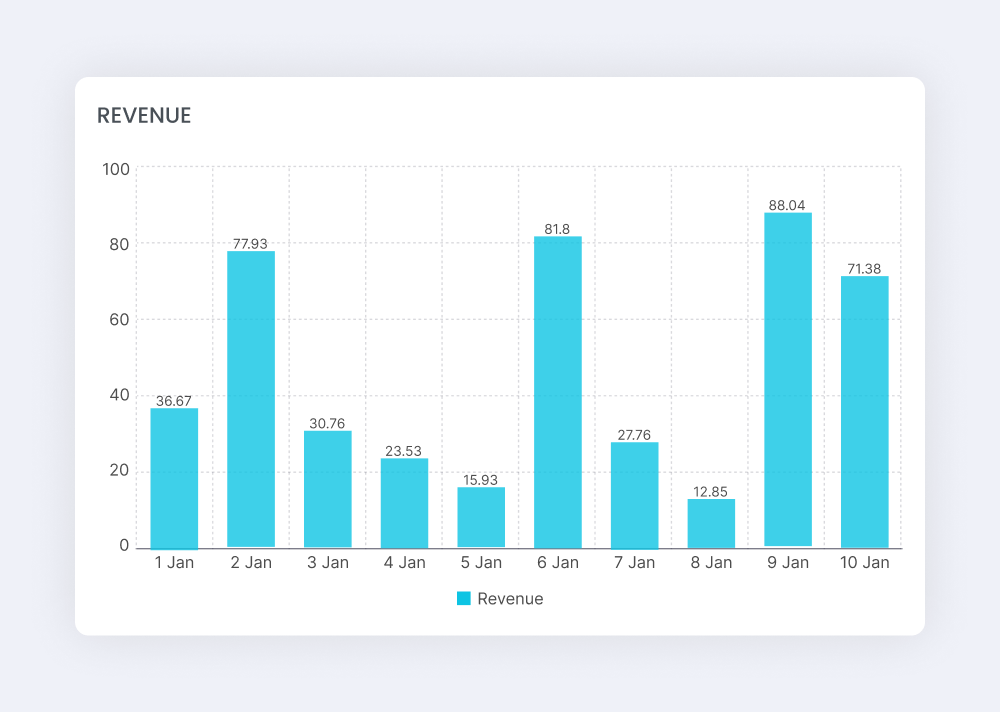
6. Revenue Intelligence
- Location-wise revenue breakdown
- Time-based revenue trends
- Payment method insights (RFID vs Manual)
User Testing
We validated the dashboard with real users.
Key Observations
- Business owners could finally track performance without support
- Ops teams identified issues faster
- Decision-making became data-backed
- Reduced reliance on Excel/manual tracking
User Feedback Highlights
- “Now I know which station is actually making money.”
- “I can immediately see where chargers are idle.”
- “This saves hours of manual tracking.”
Snippets
Redesign Impact
Learnings
- Scaling a system requires visibility, not just functionality
- Data without structure creates confusion, not value
- Hierarchical dashboards are critical for multi-entity systems
- Simplicity in analytics drives adoption
- Real-time + historical insights together create true impact
What's next?
Thanks for reading. more projects coming soon.